JNI debugging – extreme way, or what your iPad mini and ssh sessions can do for you
Yes! This article is about how to debug code using iPad mini.
This note was added after publishing the post.
I was strongly against iPads as being anything else apart advanced Angry Birds playing machine. Well, maybe e-mail reader and web browsing machine as well. But that’s it. Nothing more should be possible there – that’s what I thought. Recently, I had half day of totally spare time. Nothing to do, poor network connection. Disaster!! However, I had my iPad with me, and I had one thing circulating in my head. How to debug JNI code efficiently with ssh. Eventually, it turned out that I can do everything using 9″ screen and bluetooth keyboard. Read on.
This post was prepared entirelly using iPad and ssh sessions (No cheating! I promise). Yeap, this is possible to do actual dvelopment using iPad. Below, you can find the list of software/hardware used for this purpose:
software:
– WriteRoom – for creating post content
– Prompt – for accessing remote machine
– Safari – for posting the content into WordPress
– tmux – for better living with ssh via Prompt
– screen – for preventing loosing ssh session interrupted by Prompt
– vi – well, do you have anything better here?
– jdb – debugging Java with good old CLI
– gdb – debugging jdb with good old CLI
– java – for compiling and running Java code
hardware:
– iPad mini (without retina :) )
– Apple’s aluminium bluetooth keyboard (you can survive with on-screen keyboard, however – this was the only “cheat” from my side)
task:
– debug Java code that uses JNI
– debug native code called via JNI
solution:
– start Java VM i debug mode and listening on a given port
– start jdb and connect to JVM
– start gdb and connect to JVM
example code:
Example code is a very simple Java application that calls native procedure written in C. I will not go into details here when it comes to JNI. All you get here is a simple JNI code that will be used during the session. So, let’s go into details.
First, create some directory where you can store all the codes and then create following files inside the directory
/* Simple.h */
#include "jni.h"
JNIEXPORT void JNICALL Java_Simple_displayMessage(JNIEnv *env, jobject obj);
/* Simple.c */ #include#include "Simple.h" JNIEXPORT void JNICALL Java_Simple_displayMessage(JNIEnv *env, jobject obj) { printf("Hello from JNI!\n"); }
/* Simple.java */
class Simple {
  public native void displayMessage();
  static {
    System.loadLibrary("Simple");
  }
}
/* Main.java */
public class Main {
  public static void main(String[] args) {
    System.out.println("library: " + System.getProperty("java.library.path"));
    Simple simple = new Simple();
    simple.displayMessage();
  }
}
After files are ready, you can compile and execute the whole scenario using following command:
export JAVA_HOME=/wherever_your_java_path_is/
$JAVA_HOME/bin/javac -g *.java
$JAVA_HOME/bin/javah -jni Simple
cc -g -shared -fpic -I${JAVA_HOME}/include -I${JAVA_HOME}/include/linux \
  Simple.c -o libSimple.so
export LD_LIBRARY_PATH=`pwd`:$LD_LIBRARY_PATH
$JAVA_HOME/bin/java Main
After executing the code, you should see message
"Hello from JNI!"
This is the result of native code. Now, what we will do here is going into native code using gdb and at the same time debugging the Java code from jdb.
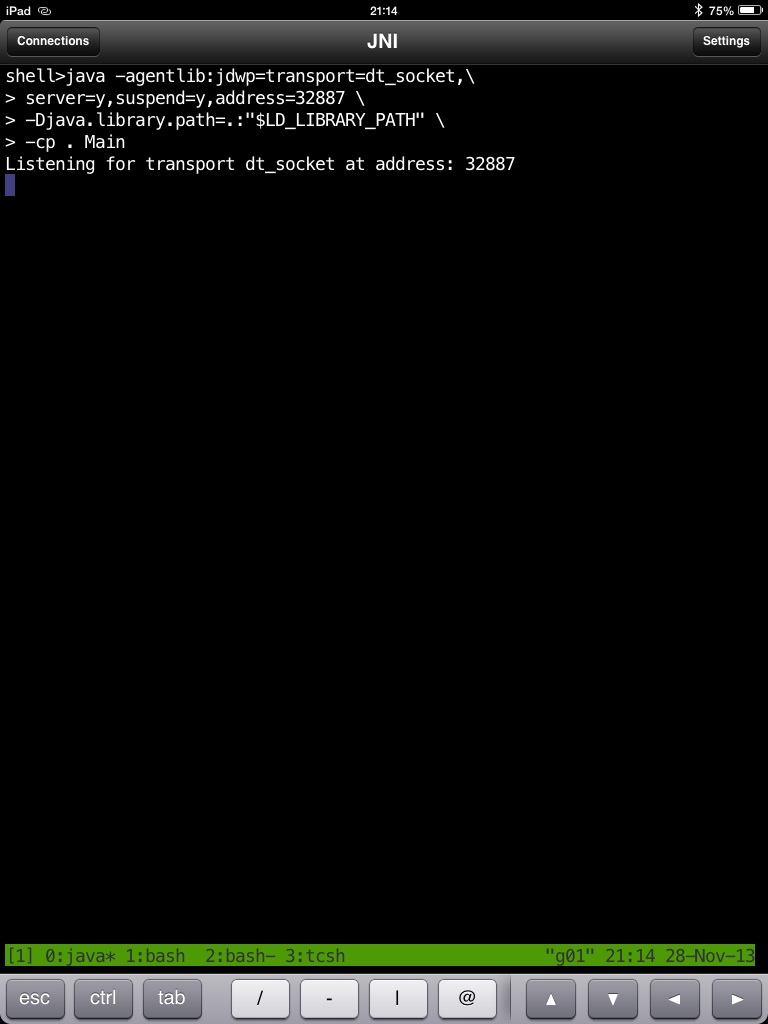
First, let’s start JVM process and susspend it – we will wait for the connection from the jdb. This way, application will be in pending state and Main.class will not be executed – yet. To do so, call java following way
java -agentlib:jdwp=transport=dt_socket,\
server=y,suspend=y,address=32887 \
-Djava.library.path=.:"$LD_LIBRARY_PATH" \
-cp . Main
You will see following message
Listening for transport dt_socket at address: 32887
And that’s how will terminal look like

Note the value “32887” – we will need it. This is the port number we will connect through from the jdb to JVM running Main.class.
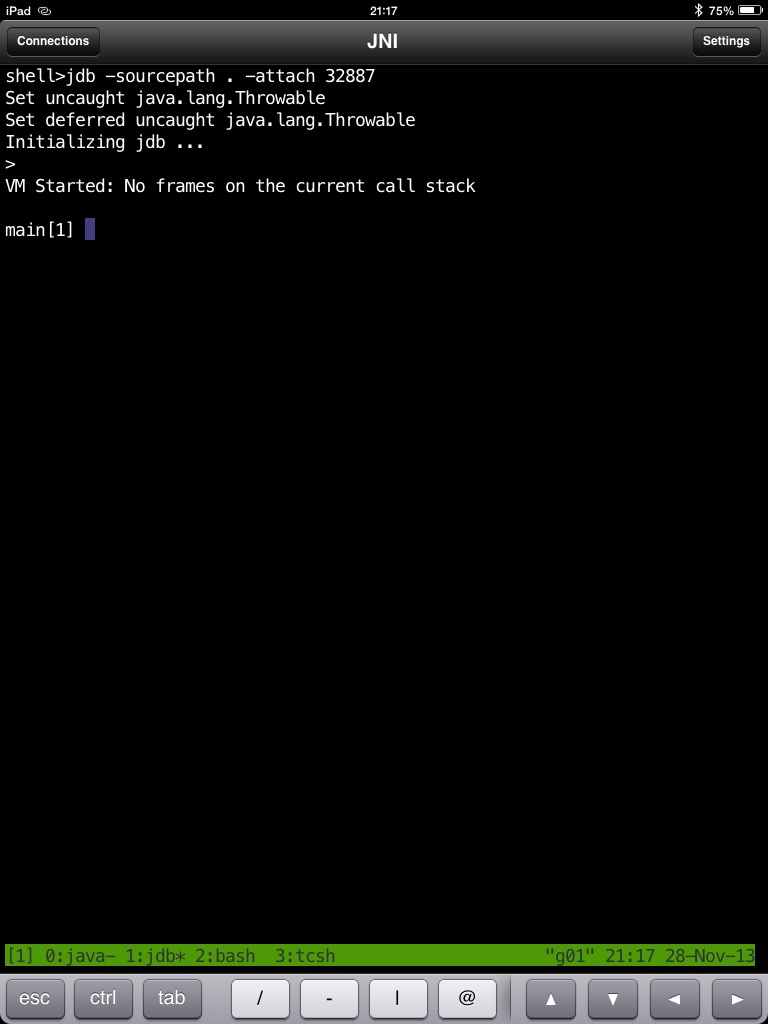
Now, go to the second terminal and start jdb. If you want to have access to sources, use -sourcepath argument. Basically, all you have to do is to call
jdb -sourcepath . -attach 32887
Afte calling it, you will see jdb being attached to the JVM
shell>jdb -sourcepath . -attach 32887
Set uncaught java.lang.Throwable
Set deferred uncaught java.lang.Throwable
Initializing jdb ...
>
VM Started: No frames on the current call stack

main[1]
You should see something like this

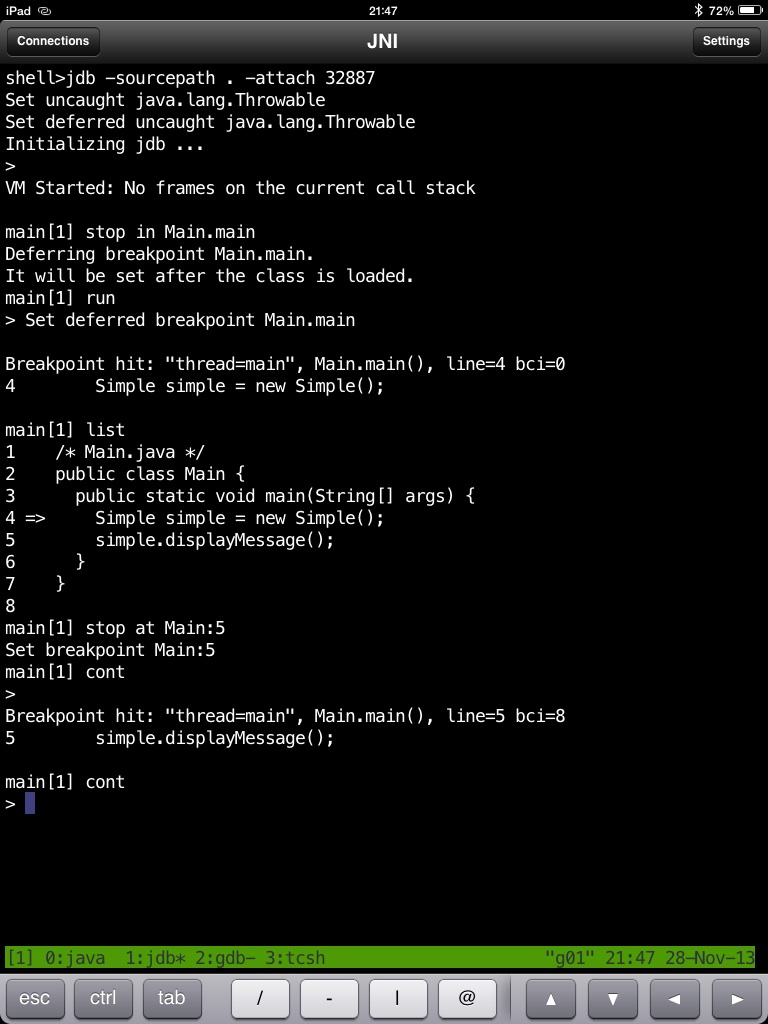
And now, we are ready to debuging. First, let’s make sure that we will brake in the code. Inside jdb type in:
stop in Main.main
run
After we hit the breakpoint, list the code using “list” command. If you take a look at the Simple.java code, you can see that during creation of the class static part of the class will load the library (native code). Let’s break after this line. We can do this following way
stop at Main:5
continue
What you should see will look following way
shell>jdb -sourcepath . -attach 32887
shell>jdb -sourcepath . -attach 32887
Set uncaught java.lang.Throwable
Set deferred uncaught java.lang.Throwable
Initializing jdb ...
>
VM Started: No frames on the current call stack

main[1] stop in Main.main
Deferring breakpoint Main.main.
It will be set after the class is loaded.
main[1] run
> Set deferred breakpoint Main.main

Breakpoint hit: "thread=main", Main.main(), line=4 bci=0
4        Simple simple = new Simple();

main[1] list
1    /* Main.java */
2    public class Main {
3      public static void main(String[] args) {
4 =>     Simple simple = new Simple();
5        simple.displayMessage();
6      }
7    }
8
main[1] stop at Main:5
Set breakpoint Main:5
main[1] cont
>
Breakpoint hit: "thread=main", Main.main(), line=5 bci=8
5        simple.displayMessage();

main[1]
Inside Prompt you will something like this:

At this point we are just before calling the native code. This is the right time to unleash gdb. In yet another terminal window we will look for executed JVM and we will attach to the correct one
shell>jdb -sourcepath . -attach 32887
shell>jps
14586 TTY
14531 Main
15161 Jps
shell>gdb /proc/14531/exe 14531
...
...
(gdb)
Now, we can take a look whether library is already loaded
info shared
You should see the entry that contains library that we use:
...
...
0x00002b8ba2864540  0x00002b8ba2864678  Yes
/pfs/home/michalo/jni
/libSimple.so
(*): Shared library is missing debugging information.
(gdb)
So, let’s break in the native code
(gdb) info shared
From                To                  Syms Read   Shared Object Library
...
...
...
 0x00002b9b18000540  0x00002b9b18000678  Yes         /pfs/home/michalo/jni
/libSimple.so
(*): Shared library is missing debugging information.
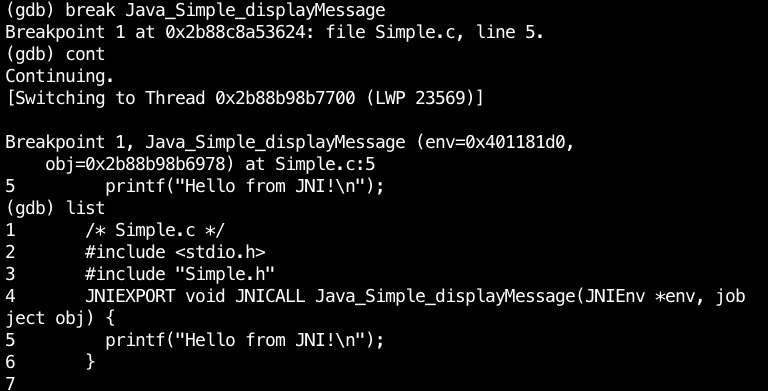
(gdb) break Java_Simple_displayMessage
Breakpoint 1 at 0x2b9b18000624: file Simple.c, line 5.
(gdb) cont
Continuing.
At this point we are contiuing the JVM’s code. Let’s get back to jdb and continue as well. As you will see, nothing happens. The point here is that we have hit the breakpoint inside gdb
[Switching to Thread 0x2b9b08e86700 (LWP 16022)]

Breakpoint 1, Java_Simple_displayMessage (env=0x401181d0,
    obj=0x2b9b08e85978) at Simple.c:5
5         printf("Hello from JNI!\n");
(gdb) list
1       /* Simple.c */
2       #include
3       #include "Simple.h"
4       JNIEXPORT void JNICALL Java_Simple_displayMessage(JNIEnv *env, job
ject obj) {
5         printf("Hello from JNI!\n");
6       }
7
(gdb)
[1] 0:java

And now, we can debug native code. When we execute continue inside gdb, jdb will continue as well, and the application will eventually finish.
shell>jdb -sourcepath . -attach 32887
shell>java -agentlib:jdwp=transport=dt_socket,server=y,suspend=y,address=3
2887 -Djava.library.path=.:"$LD_LIBRARY_PATH" -cp . Main
Listening for transport dt_socket at address: 32887
Hello from JNI!
shell>
And that’s pretty much it. So, just to conclude. In order to debug JNI and JVM at the same time:
– start JVM in debug mode (listening for the JPA connections)
– start jdb and debug the Java code
– start gdb and attach to JVM in order to get into native code
And for the summary related to the above scenario, here are few remarks on the feelings related to the whole proceess:
– I miss Cmd-Tab, Cmd-` on the iPad. Clicking Home button is so frustrating (especially when you use external keyboard)
– Prompt is dropping connections from time to time. This might be frustrating if you lose part of the work. Use screen to prevent loosing your nerves.
– Prompt will missbehave with selecting multiple lines. It simply gets lost from time to time and created arbitrary text selections when you play with the range of selected text
– Prompt will not provide you with the shell history :(
– Prompt will produce occasionally some artifacts on the screen (e.g. text from the other tmux session – which is strange)
– WriteRoom has this strange issue that attaching external keyboard leaves a bar with some functional keys and you will not see your text as it goes beyound this bar. To avoid this issue, go to projects, and choose full-screen mode (right bottom corner)
– Mouse – maybe it will be possible at some point to use mouse on iPad. Selecting text areas with touching the screen is a nightmare. Especially, when you are on external keyboard.
Anyway, I must admit that we got to the point where iPad based developement is possible and perfectly doable. Next time, I will try to do the same with Nexus 7 and compare my experience. But still, it took much more time to prepare this text comparing to what I would have to spent using OS X. And, I still have no idea how to put images into post :)
In fact, this part turned out to be super easy. WordPress simply allows you to pick images from the camera roll. And with iOS 7 it is just a matter of few clicks to make a simple image processing
Note, you can avoid using three separate terminal sessions by using gdb with java by calling it following way
export LD_LIBRARY_PATH=.:"$LD_LIBRARY_PATH"
gdb java
set args -agentlib:jdwp=transport=dt_socket,server=y,suspend=y,address=32887\
 -cp . Main
run
This way, you will be debugging JVM the same way as before.
If you are looking for more JNI samples, take a look here: http://jnicookbook.owsiak.org